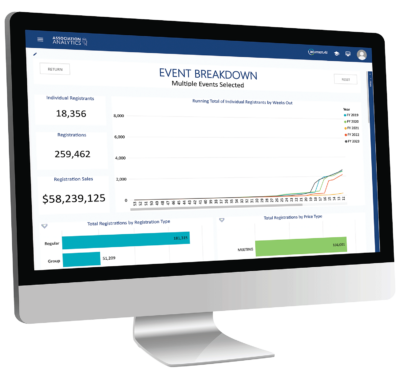
Event Data Analytics
Acumen Events helps event teams make data-informed decisions to improve event performance with comprehensive data, KPIs and built-in analyses. With a complete, consolidated view of registrations, attendee demographics, behaviors and more, you can start to optimize your event revenue and attendee experience.
Increase event attendance and engagement
By pulling in data from all your event and registration systems into one place, Acumen event data analytics for associations provides current and historical data on your event registrations and sales. Use historical behavior, transactions, engagement data and predictive models to make informed and confident decisions about your marketing and engagement efforts to boost attendance.
Predict event attendance
Acumen’s predictive attendance model assigns prospective attendees a score based on how likely they are to attend your events. You can drill down into demographics and behaviors that correlate with their likelihood to attend. Optimize limited resources by focusing on groups who can be influenced to attend the event, using data to create specific messages for each segment.
Identify virtual-only member segments
With meeting overlap visualizations, use Acumen’s event data analysis to identify which of your members engage only with your virtual programming. For many associations, this is an underserved member segment that may never attend your in-person events. Providing them with an unmet member need (virtual event), coupled with the decreased overhead for virtual courses, gives you the opportunity for new, profitable revenue, often measured in tens to hundreds of thousands of dollars.
View registrations and sales weeks and days out
Easily compare key metrics including registrations, sales and cancellations to previous years. Sort by key demographics, fee and registration types. Target specific time periods to understand the effectiveness of your promotions and marketing campaigns. Find which audience segments are dragging your numbers down or boosting your numbers up and take action based on those insights. For large-scale conferences and expos, check out Acumen Major Meetings.
Understand key marketing performance metrics
Gathering all your event data and analytics in one place enables you to dive in easily and get the insights you need immediately, without manual, time-consuming work for analysts. Event leaders can use performance metrics to inform tactics, strategies, and investments that affect overall event revenue.
See how Acumen helps major event and conference management


