Visual Dashboards Help AAPA Understand
Members & Measure KPIs
The American Academy of Physician Associates (AAPA) represents a profession of more than 168,000 PAs across all medical and surgical specialties in all 50 states, DC, US territories and the uniformed services. AAPA brings value to its members through conferences and events, discounts on continuing education, advocacy and more. To gauge its success in each of these areas, AAPA had to create ad hoc reports from a variety of data sources to figure out what people were purchasing and how members were engaging. It was an intensely manual and time-consuming process that demonstrated results at a point in time. To achieve more real-time insights, AAPA sought to centralize its data collection and storage. Furthermore, they wanted a platform that could be used by any of its 100 staff members to deliver consistent, consolidated, real-time reporting and bring transparency throughout the organization. After a review of various solutions, AAPA partnered with Association Analytics (A2) to implement their data analytics platform, Acumen in 2019. Since then, they’ve built a variety of custom dashboards in A2’s MyAcumen, a workspace that allows users to create a completely custom Acumen experience based on unique preferences and requirements.
Customized Dashboards Help AAPA Understand Its Members & Measure KPIs
AAPA built five customized dashboards in MyAcumen – Customer Care, Community, Membership, Sales and Key Performance Indicators (KPIs) – with data feeding in from several sources, including their association management system, Aptify. The KPI dashboard allows the entire organization to view and track goals. Its landing page reiterates the association’s mission, vision and values, and defines its three strategic pillars and the three metrics that are tracked for each pillar.
Examples of Metrics being tracked
Results are color coded to identify if goals are accomplished, at risk or not accomplished. Plus, users can hover over a goal and click for a more comprehensive drill down of what’s specifically measured within a given KPI. For example, a user can see an overall product utilization metric and click into that metric to see utilization percentages by specific products, what products are used based on a PA’s stage in their career and more. This helps AAPA refine product offerings as needed. Volunteer engagement is also now tracked and reviewed as part of AAPA’s comprehensive grassroots efforts – tracking this behavior has allowed AAPA to tweak engagement strategies.
Kristin Sanders, AAPA’s Director of Data Analytics says, “The big win for me and Acumen is being able to use a filter to quickly visualize by product or member type, allowing us to dig in and further analyze our products better. Previously, we were only tracking what we could, and the data wasn’t as comprehensive. We’d have to create a report for each product. Now, we can take deeper dives with greater frequency with just a few clicks.”
In 2022, AAPA’s KPI module was used to track progress towards goals quarterly throughout the year. AAPA used these numbers to project new KPI goals for 2023 based on the previous year’s performance. For example, in 2022 AAPA’s Partner Benefit Utilization metric tracked 111% to goal. In 2023, AAPA will build on this momentum by improving existing partner benefits, launching new partner benefits, and securing more and better data from partners to measure and grow the value AAPA provides to members by way of partnerships.
The Value of Anytime and Point-In-Time Reporting
Prior to Acumen, AAPA had to create ad hoc reports to track members by age, year joined, ethnicity and career stage, and they could only pull this information based on a member’s current status. They created a “Membership at a Point in Time” dashboard that now enables them to select filters based on fiscal year and month to find the member type of a user at a specific point in time. They can select by start date, end date and expected graduation date to see how member types are progressing or changing over time.
Dashboard Simplicity and Gamification Builds Adoption
The simplicity of AAPA’s KPI dashboard helped drive platform adoption among AAPA staff. Kristin states, “We started with monthly meetings to highlight different use cases to drive adoption. We also added a gamification element to our monthly staff email with a data question that requires users to do a data dive in the system and HR supplied a prize. However, driving adoption was easy because the dashboards are customized to the way we speak about our goals, and everyone is so attuned to their contributions to our KPIs. Accessing dashboards is easy for every user, enabling our staff to dig into their data. People like that they can use a variety of filters and they don’t have to worry about breaking anything. They can click as many times as they want and erase as needed. There is so much positive feedback on having data available at our fingertips. Everyone sees the value of making data-informed decisions and is excited by the transparency. Our CEO and senior leadership want us to have a more data-driven culture and they continue to drive utilization and enhancement of MyAcumen.”
Up Next: Learning Dashboards
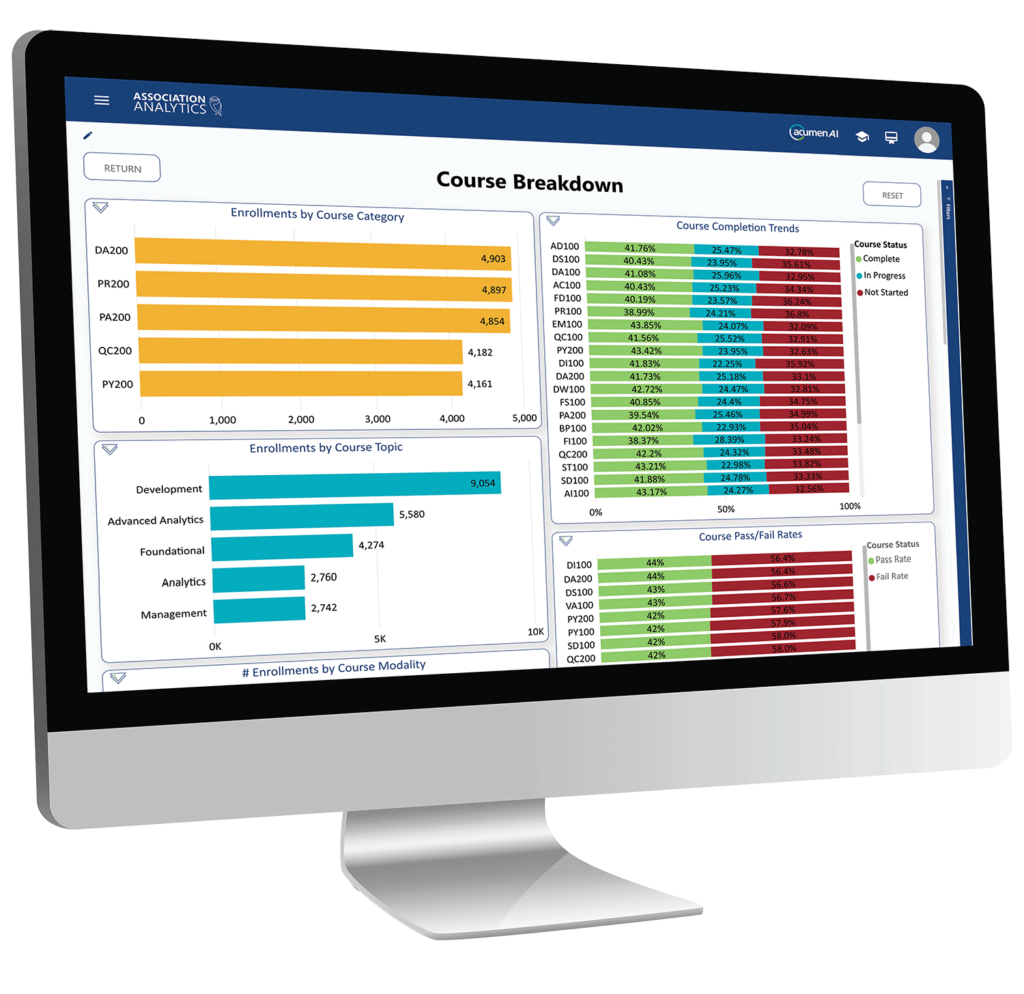
AAPA just completed development on a custom learning dashboard that will allow them to see what products are being used and which continuing education classes are started and completed. The simple tracking of utilization will enable them to report on grants, something they could not easily report on before. The report will also help AAPA understand how to better segment and target their marketing to drive usage for specific products and services. Also in development is a new internal dashboard that will help them track student memberships at a deeper level and understand what benefits student members use and whether they’re converting to professional members upon graduation.
Data is Your North Star
When asked what advice she would offer to an organization early in its data journey, Sanders says, “Data is your North Star; it guides you in everything. You can’t operate without it. If you don’t know where you’re at, how do you know how to move forward? How do you know what’s driving conversion or profit?
It’s so awesome to have everything in one place, and Acumen offers a clean and inviting interface with navigation that’s easy to use and great visualizations – even for those who are data illiterate.
“The way Acumen is packaged with everything all together makes it so useful and helpful to associations. I also love Association Analytics’ conferences and webinars. They offer so much inspiration and great ways to help me grow and improve.”
About American Academy of Physician Associates (AAPA)

AAPA advocates and educates on behalf of the profession and the patients that PAs serve, working to ensure the professional growth, personal excellence and recognition of PAs. AAPA also works to enhance PAs’ ability to improve the quality, accessibility, and cost-effectiveness of patient-centered healthcare.

