The Magic Quadrant
In February 2013, Gartner Inc. released an important report entitled Magic Quadrant for Business Intelligence and Analytics Platforms which details the current state of the business intelligence (BI) market and evaluates the strengths and weaknesses of several of the top vendors. It’s interesting to note that in this report, Gartner emphasized the emergence of data discovery into the “mainstream business intelligence and analytics architecture”, something we have been highlighting at DSK Solutions for years.
What is data discovery? Associations and nonprofits are sitting on large quantities of data and don’t always realize the value of this powerful asset. The old days of spray and pray are gone. Remember direct mailing blasts? How ineffective! Associations were shooting in the dark and wasting resources that could have been allocated to better serve members. Unfortunately, some associations still rely on this marketing approach, but there is a better way: segmented target marketing based on data.
All of your data – including CRM or AMS (customer data), general ledger and budget (financial data), and Google Analytics (Web data), can be pooled together to illuminate your member strategy. Think of each data source as a small flashlight that reveals a little bit of the path in front of you. When your data sources are pulled together, the path becomes much clearer. When analyzing your data with data discovery, it becomes possible to discover things you did not know before.
Necessary Steps
Clients frequently come to us seeking guidance on how to begin the task of leveraging their data to inform better decision making. Before you can embark on data discovery, you have to do two things:
- Ask the right questions. What is meaningful to your organization? What are you trying to find out about your members, prospects, products, services and profit?
- Clean your data. If your data is filled with duplicates, inaccuracies, inconsistencies and other forms of noise, your analysis will be flawed. Remember: Garbage in, garbage out. Quality data as an input allows for accurate analysis as an output, which results in the improved ability to make good decisions.
These two steps form the foundation of the data discovery process. Almost always, the answers you derive from your data will lead to more questions. It’s okay to ask why. In fact, you should be asking why! Start by asking questions like these:
- How dependent is your association on dues revenue?
- What is the price elasticity of membership (Full Rate v.s. Discounted Rate)?
- Which members are at risk for not renewing?
- How far (in miles) will registrants travel to attend a meeting?
- Which products or services have the highest profit?
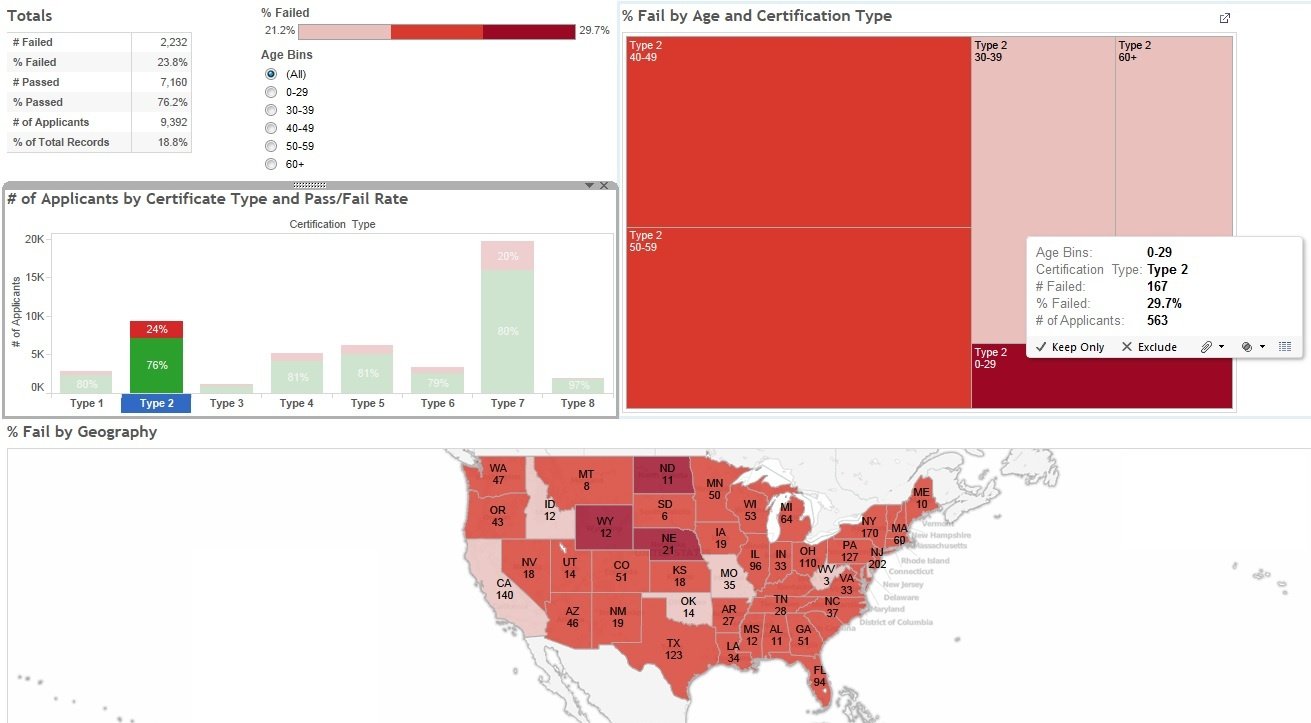
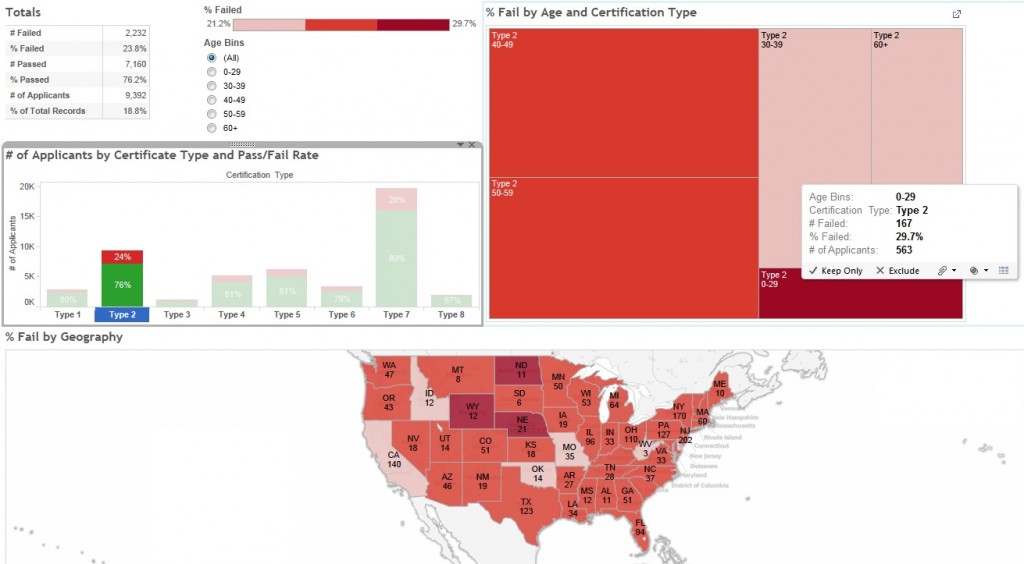
Then start asking “why”. Remember the idea of the Ishikawa (or fishbone) diagram? It’s an easy and useful way to begin thinking in terms of cause and effect – you ask “why” 5 times, until you arrive at the root cause of an effect. Now with interactive data discovery you ask these questions directly by interacting with the data in a visual way! At DSK we describe it as “having a conversation with your data”. For example, a certification department of an association wanted to look at their pass/fail ratio for an exam. Using data discovery, they discovered many more college-aged people were registering and doing poorly than in the past. In the process of asking “why” the failure rate was increasing, they discovered an opportunity not only to publish a new study guide, but also they located an entire new source of prospective members and created a new membership type to serve the college market.
Data discovery is an iterative process where you ask questions of your data in an interactive way. Drilling down both vertically and horizontally into your data allows you to not only answer the questions you know you have, but shed slight on those unknown-unknowns and enables associations to make better decisions.