The NFL season may have come to end, but analytics for associations is like a year-round sport! All industries are recognizing the value analytics in optimal decision-making, and professional sports is no different.
The goal of a team in an NFL game is simple – score more points than your opponent. This can be translated into the statistical concept of maximizing the expected value of outcomes, meaning a team should make decisions throughout the game that result in scoring more points relative to their opponent.
The New York Times has a great article about a “4th Down Bot” that uses analytics to predict the optimal decision when facing a 4th down situation among punting, attempting a field goal, or going for a first down. We’re not suggesting that you turn your association over to bots, but we’ll about decisions that maximize your chance of achieving your goals!
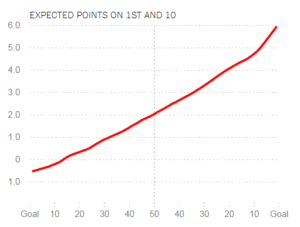
The application essentially uses historical data to predict the net points for different situations and accompanying decisions. For example, this chart depicts the expected points for different yard lines of the field for 1st and 10 situations.
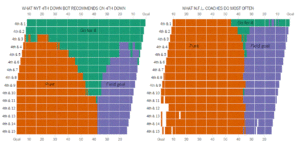
The Bot, like other analysis performed over the years, concluded that teams clearly are conservative and should go for 1st downs far more often. This chart summarizes the results as shown by the much larger shaded area for “Punt” in the “What NFL Coaches Do Most Often” column.
We can approach this Bot and the analysis, conclusion, and visualizations just like we would any analytics of an association.
Conduct a Quick Review
We need to understand the overall data prior to drawing conclusions. What should we think about as part of an initial mental review?
- The granularity of the data should be at the level needed for analysis. The data labeled based on yard. Decisions for short yardage situations are impacted by feet, or even less. If more granular data is not available, you might want to collect it in the future.
- The timeframe represented by the data should consider key changes. Rule changes implemented over the years, such as the starting point after a missed field goal and the introduction of the two-point conversion, influence decisions. A similar example is changes in membership models and pricing over time.
- The volume of data should be adequate to draw reasonable conclusions. The frequency of situations can be very different. More about this later.
Think About Potential Issues
There are always other considerations that don’t directly show up in the data. What else do we need to think about?
- The author of the Bot described several considerations. Examples include weather conditions, team skills, and desperation near the end of games. You should also describe any potential limitations in your data. A data-driven culture helps acceptance of data that is imperfect, yet still valuable.
- You might discover unexpected external forces that impact your data and analysis. You should evaluate decisions guided by the data when these arise.
Consider Visual Display
We can’t help but to immediately think of alternatives when we encounter a visualization. How could we expand on this visualization?
- A visualization focused on differences between the optimal and actual decisions for difference situations, such as bars above and below an axis might be compelling.
- The volume of data available for difference scenarios could be depicted by color intensity or similar indicators.
- Close alignment of field position and yards-to-go comparison could provide more focused analysis.
Consider an overall analytic workflow with interactivity, exploration, and drill-down capabilities using tools such as Power BI and Tableau enhance any visual analysis.
My colleagues with far greater expertise have several interesting blog posts on this topic, including those found here, here, and here.
Ask Why
The most important insight is understanding the reasons for differences between seemingly optimal decisions and actual actions. Coaches have incentives just like association staff. Coaches tend to be risk-averse as they are much more likely to be criticized for not doing what is customary than they are to be rewarded for taking risks. That isn’t exactly making decisions with confidence!
Associations can take deliberate action drive optimal data-guided decisions.
Leadership
It’s important that leaders adopt an analytical mindset and make analytics a priority of the organizations. Leader should accept risk justified by data as well as empower business staff.
Measurement
To change the risk-averse mindset of media, fans, and team management, NFL coaches need to measure results over time. Another common challenge is a tendency to favor intuition over data when the data-guided decisions are not perfect – even though the decisions based on data are superior to those based on intuition. These ways of thinking can also be found throughout associations. Measurement is vital to ensure analytics adoption and learn for the future.
Commitment
Becoming a data-guided organization includes challenges, but it is important to maintain commitment. For example, you might need to send fewer marketing emails to understand the impact of analytics, market your annual conference differently to gauge the impact of geography, and sacrifice near-term revenue to determine if increases result in other areas. These risks are vital to the ongoing improvement of analytics.
It is always important to know where you are on the field, understand the situation, and realize the strengths of your team. This can be accomplished by developing a roadmap and understanding how you should structure your analytics team.
Unlike an NFL team, you should never be content to just punt or run out the clock with analytics!


