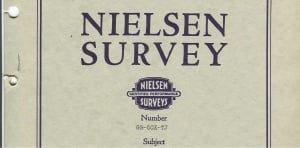
Do you ever wonder why we’re still using the Nielsen ratings? These are the ratings used for measuring TV show popularity and demographics. They’re heavily criticized for being inaccurate but still relied on heavily by networks and advertisers. I was surprised to learn the company still collects some of its ratings data by sending paper surveys to American households. The recipient must document every minute of every show watched on any TV in the house for an entire week in a paper journal. At the conclusion, the survey is mailed back to Nielsen where someone goes through the journal and enters the data manually into a computer. Once all the surveys are received and entered, the data is crunched, combined, and out comes a rating number. These methods have been around for decades. While they may have worked before computers and before households with multiple TVs, today they have some big disadvantages. Compared to electronic collection, it is more subject to response bias (only collecting data from those who choose to respond, and they may over/under report certain types of programming). Since it reports mainly on household habits rather than individuals, it misses key demographic information because it mainly reports on household habits, not individuals. Worst of all, it’s missing the automation and efficiency of more modern collection and measurement methods.
Let me bring this back around to associations and dig into a specific example of where you might see this concept of outdated data collection and management in your organization. A common manifestation of this is preparation for a board meeting. It often takes a team of people working 2-4 weeks to collect and summarize all the data points that are desired for analysis in the meeting. After all the effort, the data is already outdated and doesn’t provide any detail beyond the summary level. Wouldn’t it be nice to collect data the same morning or, even better, view and interact directly with near real-time data on a visualization/dashboard during the meeting?
For many associations, replacing manually generated reports is the first tangible benefit of a data analytics initiative, saving hours of staff time for collecting and calculating data. Other benefits include:
- Updated information available on demand
- Establishing a common language across the organization for complex concepts and formulas such as member retention and engagement
- Consistent formulas for calculations and used repeatedly
- Instant ability to ask/analyze new questions based on insights gained or patterns recognized
- Visually compelling and interactive presentation
If you’re still using manual methods like the old Nielsen surveys, it is costing your team and your organization dearly. Act now and start reaping the benefits of modernization in your association’s data collection and presentation.


