The pandemic unexpectedly transformed how organizations hosted their events and meetings, forcing event planners to quickly pivot and move their meetings to virtual platforms. Now, as the world is opening back up, your association may be planning to go back to in-person meetings or use a hybrid approach. Whichever format you choose, you should consider your historical event data as you develop your event marketing strategy.
Be deliberate as you start to dig into the data you need. What business questions do you want answered? Sure, you can look at historical or yearly trends on a graph to identify patterns, but by drilling deeper into the analytics you can uncover insights to help put your data into action. In our previous blog posts on retention and product value, we illustrated how data isn’t one dimensional. Similarly, analyzing your event data from many angles can lead to a major impact on revenue.
Consider these data points as you assess your event registrations:
What trends or patterns exist in your registration data?
Year over year, is it increasing or decreasing? Does it fluctuate? Perhaps it’s remaining steady. Throughout the year, do you see a seasonality pattern when registrations increase? Tie past spikes in registrations to the marketing initiatives taking place during that time so you can better understand which approaches and messages led to the most registrations.
Which types of people are attending in high numbers?
Breakdown attendees by job type, organization/company, age, location, tenure, behavior, repeat attendees and more. Look where you’re having success and where you’re not, then dig in to understand where you may have some underserved populations. Perhaps some of those segments aren’t aware of services or aspects of the event they might find valuable.

If certain groups aren’t attending, try to determine a possible root cause. If particular role types are not attending, take a look at your content and determine if it makes sense to create sessions or a learning track that addresses their needs. Do a scan of the market to determine if this segment might be obtaining their content from another source.
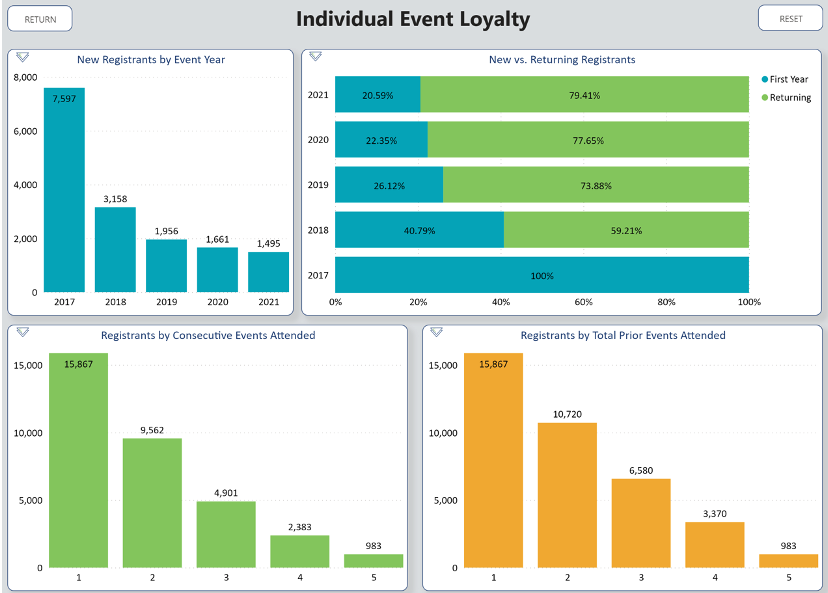
What factors influence first time attendees?
This is a valuable group. It’s important to know what motivates them. Is it the networking opportunities? Is it getting a certification? By narrowing down their motivation, you can market that value to prospects with similar characteristics. Understanding these motivations can help drive marketing messaging to encourage other first time attendees. By cultivating a strong relationship with this group you can also foster repeat attendance. As a bonus, many associations find that repeat event attendees also renew at higher rates. (Do your repeat event attendees also renew at higher rates?)
Let’s take a look at how event data can be put into action.
- Situation: We’ve looked at the trend analysis and it indicates that we are not projecting to make our registration goal.
- Approach: Knowing that loyalty is a key factor in repeat attendees, we can look at the historical data by years of attendance. This data shows that attendees at the three year point have the highest drop-off rate. (Do you know where your drop off point is?)
- Action Plan: We make the assumption that this drop off is due to fatigue, seeing and experiencing some of the same speakers, sessions, exhibits year over year. We test our assumption by designing a targeted A/B email test for this group. We send a discount code vs. promoting what’s new at the next event.
- Results: We measure performance of the test and roll out the most effective campaign based on registration numbers.

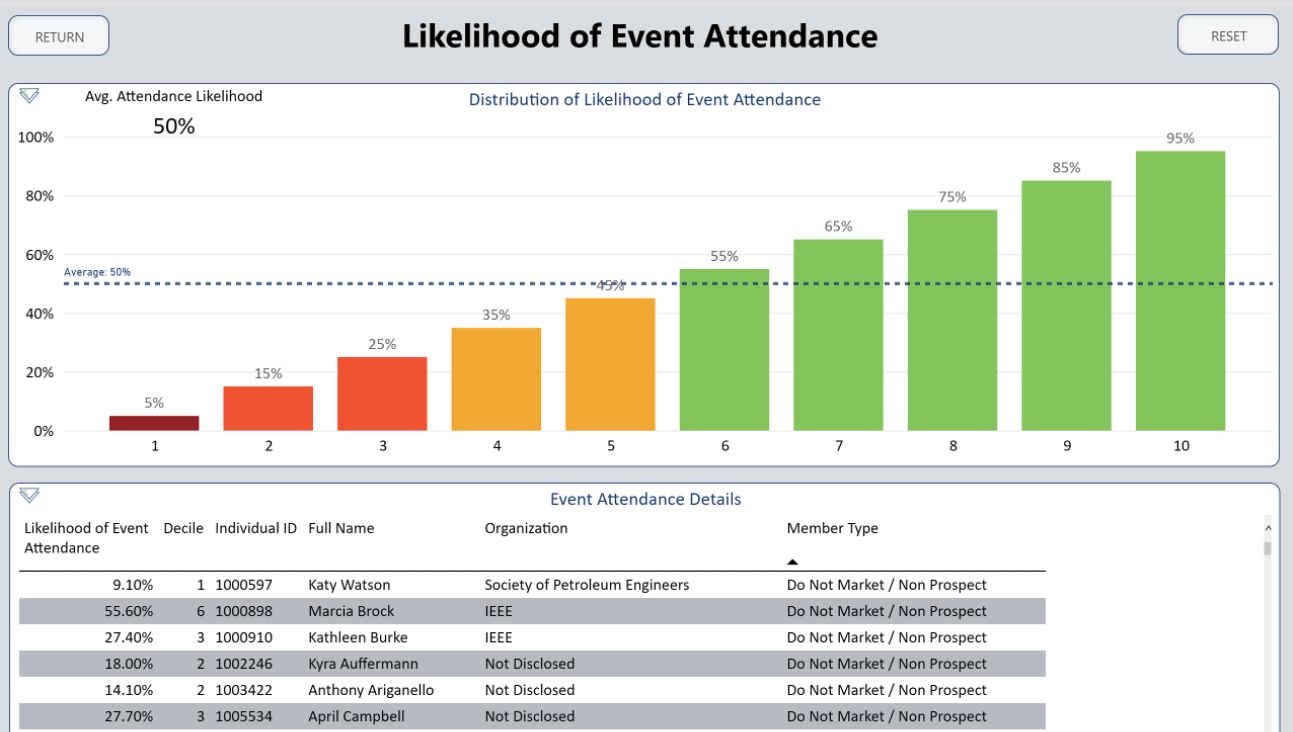
Another way you can put data in action is by using predictive analytics to identify what factors really move the needle for registrations. This will help you answer the age old question of “where do I spend my marketing dollars?” Predictive attendance models scour data to predict event attendance based on a set of defined candidate predictors. You can look at a member base by who has and hasn’t attended in the past as well as other data such as gender, lifecycle, job function, member type, age, behaviors, and more. A typical predictive model will analyze your database and place members into 10 deciles (buckets) from the least likely to most likely to attend. For those most likely to attend, you know you can skip the discount code and the expensive marketing pieces. Same for the most unlikely to attend. You can laser focus your marketing on the middle buckets, smartly spending your marketing budget.
Important Tips:
- Please note that the analysis should be done for each of your events as they may attract different audience segments. For example, people who attend your Annual Meeting may not overlap with the same group that attends your Technology conference.
- When looking at trends, be sure to include contextual data to get the full picture. For example, in 2020, when everything was remote, did your attendance spike because people could attend virtually? Or did it decrease because your members were longing for that in-person connection?
- If you change event registration systems, make sure you get all of your historical data from your old system.
- Consider a technology approach that enables real-time access to your event registration data. If using a third party, sometimes the data is provided after the event. Real-time access enables you to spot trends and course-correct with your marketing and promotion as needed.
We suggest you be forward thinking and capture as much data as you can now. Being armed with the appropriate data points will allow you to strategically execute your marketing efforts to boost registration revenue.
Our data analytics platform, Acumen, is helping tons of associations with their event registration data. It allows for real-time data access and brings together all an association’s data in one place so they can visualize, analyze and put it into action. Schedule a demo to learn more.


