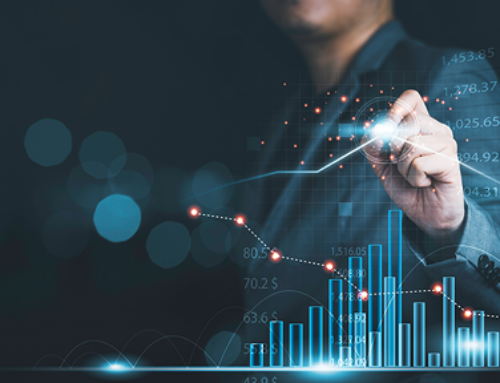
Visual data discovery is an agile and iterative way for associations to answer questions with data. Because we often don’t know what all of our data questions are, we must have the freedom to explore and improvise, refining our questions as see the results. Because the visual system processes images 3x faster than text, visual data discovery is a faster and more intuitive way for associations to interact with their data.
Christian Chabot, CEO of Tableau Software, reiterated this point during a recent inspirational keynote. He explained that great thinkers’ minds operate to change the world – they combine logic and intuition in an artful way. Great insights are made by combining deduction with feel; structure with improvisation; science with art. Einstein was famous for “feeling” his way through great discoveries.
Each day we generate and collect more data, and the pace is increasing fast. But ask yourself – does modern software amplify your intelligence and creativity effortlessly? In some cases it does. For example Google enables almost effortless searching. However many traditional enterprise business intelligence platforms are designed to work in a way that is exactly the opposite of the way great thinking occurs because of their architecture and heritage. You have to know your questions before you start.
Visual data discovery should allow you to follow your intuition, chase hunches, and change perspective. Leveraging a technique from great thinkers by allowing you to uncover relationship hidden within your data. Just image being the first one to make an astounding connection for your association! For example, you may discover that individuals who submit abstracts for your annual conference always attend, regardless of whether they are selected to present. Imagine how you could then refocus your efforts during the call for presentations to receive a larger abstract submission pool, knowing it would result in greater attendance. What would discovering something new about the behavior of your customers mean for your association? Data visualization and discovery tools support your great thinking by helping you “feel”, chase, shift and improvise and see connections between your association’s data.


