In December we posted a blog about how and why it is recommended to upgrade your association’s Google Analytics account to the Universal Analytics tracking code format. By now it is expected you have, unless you are using one of the features that prevents your association from doing so. With Universal Analytics in place, it is time to take a look at adding more value to your analytics by creating custom dimensions and/or metrics.
The definitions for Google Analytics dimensions and metrics are the same as they would be in Tableau or any Business Intelligence Tool. A dimension describes data and a metric measures data. An example of a dimension is geographic location and measure value examples for that dimension could be Los Angeles and Orlando. An example of a metric that would also correlate to geographic location is Population. A city’s population can be measured the count of all the residents.
Everyone can agree that Google Analytics reports on an enormous amount of data, but you can add data points that are specifically relevant to your association. For instance, what about tracking the author of a particular article? With a change in the configuration and the tracking code, it is now possible to add custom dimensions and metrics into Google Analytics. One last note before you begin, custom dimensions and metrics cannot be deleted once created but they can be marked as inactive. Remember not to reactivate and reuse them for different purposes later.
Instead of repeating the 8 step detailed instructions for creating a custom dimension or metric, please refer to the instructions provided by Google at this location: https://support.google.com/analytics/answer/2709829.
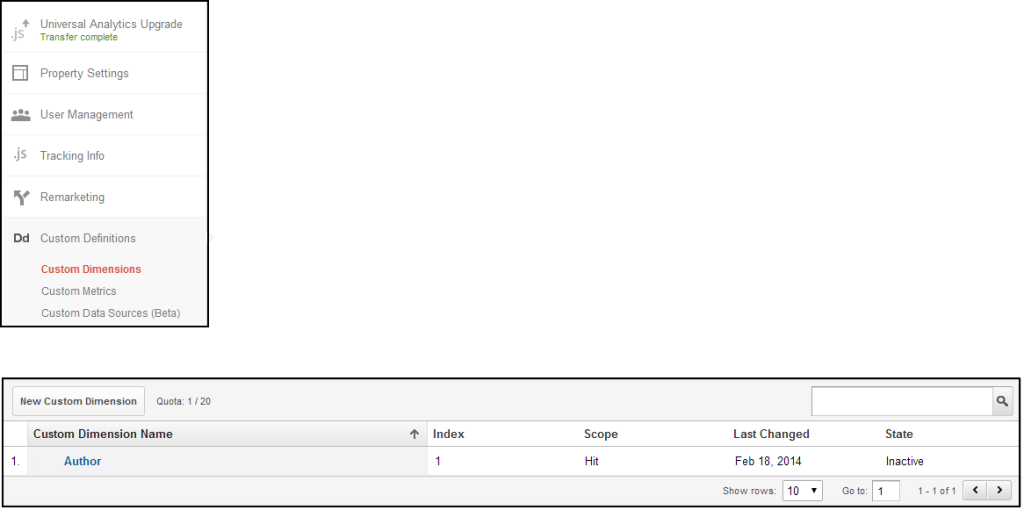
One of the steps does require the JavaScript tracking code on the site to be updated, so collaborate with your developer so you can be sure the data is collected correctly. The image below of the admin module will aid you in navigating to the correct location of the admin module to begin the process.
The screenshot shows the author of an article was created as a dimension. Because it is an attribute (of the article) and it can be assigned different values (Alan Weinstein, Debbie King), it is a dimension and not a metric. In the reports it can be combined with different metrics to create meaningful reports such as the most popular author across the entire library of articles on the site. With that information in hand, you might want to have the most popular author post more, or have the least popular author adopt the same writing style as the most popular author. You can continue to monitor the website visitors’ behavior to determine their pattern of engagement with your website. Similar steps can be implemented in the areas of events, publishing, certifications and more.

Your members and customers look to your association for professional guidance. Understanding how they interact with the content on your website and providing relevant information they specifically want will increase their engagement and the value you add to their lives. The best ideas about how to serve your audience come from your customers! Take advantage of your website’s data to build relationships with the people who visit and interact with your pages. After all, it’s human insight that drives your mission to serve your members.


