
In part two of our Data Quality Management (DQM) series, we outline how to assess your association’s data quality. The two primary goals of a data quality assessment are:
- Identify data anomalies through data profiling
- Document and refine data quality rules
At the end of your assessment you will have the following four outputs. In today’s post we discuss how to tackle the first two (below) and in our third blog on this topic we will cover the second two.
- Catalog of data quality issues
- Rules catalog
- Common Language Dictionary
- Data Quality Scorecard
Data Profiling
Data quality assessments begin with the data profile. Data profiling is the process of uncovering data issues by reviewing the content, structure and relationships of the data sources.
There are three types of data profiling:
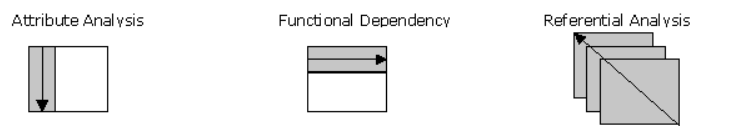
Figure from http://docs.oracle.com/cd/B31080_01/doc/owb.102/b28223/concept_data_quality.htm
- Attribute analysis
- What is it? – A column down analysis, this will identify any issues with a particular column. You will verify the data for:
- Validity – Is the value valid for that field?
- Accuracy – Is the value accurate for this record?
- Consistency – Is the value consistent across the board?
- Completeness – Do all columns have a value?
- Uniqueness – Can there be duplicate values in the column? Does it require each field to be unique?
- How do I do it?
- Filtering – by using a filter you can quickly spot any data that is not valid, consistent or complete.
- Aggregating
- Summing – by summing a column you can see if any data is not accurate. For example, if you sum the registrant fee column for an event and the value is $50K less than what you expected then the data may not be accurate.
- Maximum and minimum values – by identifying the maximum and minimum values of a column you can easily spot any data that is not valid or accurate. For example, if you identify the maximum and minimum registrant fee in your data source and those fees do not correspond to fees that you offer, then the data for those records may not be valid or accurate.
- Visualizations – by creating visualizations, your eye can quickly spot anomalies in data. For example, if you create a quick a year by year comparison of event revenue and the revenue for one year is significantly lower than all other years, you will want to check to see if your data is complete.
- What is it? – A column down analysis, this will identify any issues with a particular column. You will verify the data for:
- Functional dependency
- What is it? – This type of profiling looks at the relationships between columns. For example, when you enter a value for field A, if there is a functional dependency, then the values for field B consist of a predefined set of choices based on your business rules. A common example of a functional dependency issue is when you have Canadian records with values that are equal to U.S. states rather than Canadian provinces.
- How do I do it?
- Sorting – For example, by sorting by country then state, you will be able to scan columns and quickly identify any data that is not valid.
- Filtering – by filtering by country, you can review the states tied to that country.
- Grouping – if you group by country and then do a count by state you will be able to spot any data that is not complete or valid.
- Referential analysis
- What is it? – This type of profiling looks at the relationships across tables. For example, if an individual purchased an event registration fee, but is not registered for an event, then the information is not complete.
- How do I do it?
- Determine data relationships – first determine any tables/columns that are dependent on values stored in another table
- SQL queries – write queries that verify that a record has a corresponding and appropriate value in a parent table based on the child column’s value
- Advanced excel calculations
- VLOOKUP – this formula will return a true/false value if the column exists in another worksheet/workbook
- COUNTIF – this formula will return an integer based on the amount of times a column exists in another worksheet/workbook
Data Rules
Once you have the results of your data profiling, review and refine your existing data quality rules.
- Identify and collect your current data rules
- Determine “how clean is clean” for your association. Some data is more important than other data.
- Determine the cause of any data issues. Once you know the cause you will be able to create rules to prevent these issues.
- Questions to be answered:
- Are these data entry issues?
- Is there an automatic process in place causing incorrect values to be inserted in the data source?
- Process for determining cause:
- Ishikawa diagram also known as the fishbone diagram. You will determine the causes of issues and then categorize them. One of the best ways to determine the cause-and-effect relationship is to use the “5 Whys Technique”:
- Determine what problem you are addressing and make sure everyone on the team has reached consensus on the definition of the problem. You do not want to waste time by having your team trying to determine the cause of different issues.
- Ask the team ‘why the problem happened?’. Document the answer the team provides.
- If this answer does not answer the underlying reason for the problem, then ask yourself ‘Why’ again. It is unlikely that you reached the root cause in the first round.
- Continue asking ‘Why’ until you have determined the root cause and there is agreement among the team that is the cause.
- A good rule of thumb is to ask ‘Why’ 5 times.
- Change Logs
- Review your change logs to see if an issue is being caused by a person or process. If it is a person, check to see if the issue is coming from an internal (staff) change or external (web user) change.
- Ishikawa diagram also known as the fishbone diagram. You will determine the causes of issues and then categorize them. One of the best ways to determine the cause-and-effect relationship is to use the “5 Whys Technique”:
- Stakeholder interviews – interview those who work with the data on a daily basis to determine what they think is causing data issues and their level of confidence in the data
- Questions to be answered:
What’s next?
In our third blog in the DQM series we will discuss how to create a Common Language Dictionary and a Data Quality Scorecard as well as how to tackle data cleansing. Also see our first blog in this series about creating an association data quality management plan.


