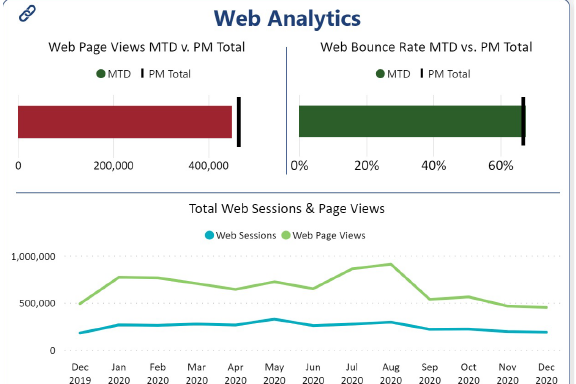
An association website provides invaluable data and information on what your customers (i.e., members, prospective members, nonmembers, and the public) care about, what they don’t care about, and how they find information. By analyzing this data with website analytics, you can help your association provide valuable, engaging customer experiences.
There are a number of tools available for website analytics. Google Analytics is probably the most well-known. Regardless of what tool you use, there are some basic steps that will help you get the most out of your website analytics:
- Define business goals and important conversions. This should be based off the association’s strategic plan. A conversion might include someone joining membership, subscribing to a publication, registering for an event, etc. When listing your key conversions, consider what actions your optimal customer would take. What are the customer actions that have the greatest impact on your association’s ability to achieve its goals and objectives?
- Select meaningful key performance indicators and goals. Website KPI’s could include:
- Visits (Sessions), Unique Visitors (Users) and New vs. Returning Visitors
- Traffic Sources
- Bounce Rate and Average Session Duration by Channel
- Conversions and Conversion Rate by Channel
- Cost per Conversion, Profit and ROI (Return on Investment) by Channel
- Determine audience for reports. Before developing reports or visualizations, consider the audience. Design reports that will be meaningful to the intended audience. Think about the goals of your audience and strive to exclude extraneous information.
- Analyze data. Investigate things that surprise you or dive deeper to find relationships.
- Take Action. Take action from what you learn and make modifications based on what you learn.


