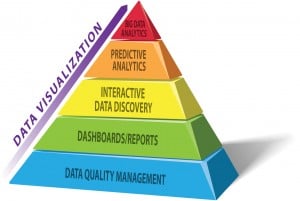
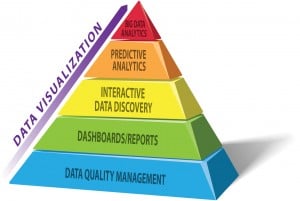
5 Steps to Visualize Association Data

1. Scope your Project
Start small and define success with your stakeholders. Outline what you already know and document your business questions.
2. Collect your Data
Identify your data sources then describe your business rules in plain English. Inventory and integrate your data for future projects as well.
3. Clean your Data
Determine how clean is “clean” for your organization. Correct duplicate, missing, and inconsistent data and create standard processes to prevent future data issues.
4. Analyze your Data
This is the fun part! Create data visualizations and evaluate the results based on your business context. Did you answer your original questions or discover new questions that ‘you didn’t know you didn’t know?’ It’s an iterative process that will evolve based on feedback.
5. Communicate your Results
Describe the results with meaningful stories to start the conversation. Make sure the level of detail is appropriate for the audience and document new questions that surface for future analysis.
This brief video further illustrates how your association can harness the benefits of BI and demonstrates Tableau data visualization software.


