Did you know that approximately 70% of the body’s sense receptors reside in the eye? Of all 5 senses, vision stands out dramatically as our primary and most powerful channel of input from the world around us! Not only that, but apparently, “the eye and visual cortex of the brain form a massively parallel processor that provides the highest-bandwidth channel into human cognitive centers.”* I envision a super highway from the eye to the brain. This helps explain why data visualization is so powerful.

In order to make good decisions from data, you’ll need to not only be able to see the data, but also successfully analyze it. There are experts who specialize in this area, but you may have the aptitude to successfully analyze data as well. Just as a sonographer may have years of experience and training in reviewing ultrasounds, with just a little direction, first time parents can see their baby’s image and delight in her features, especially when the sonographer helps out by positioning the wand to get the classic profile picture! What is needed is the skill to see meaningful patterns in data. This can be learned and developed with practice. It is definitely something I enjoy!
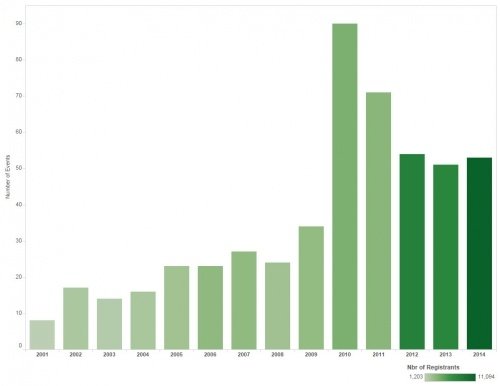
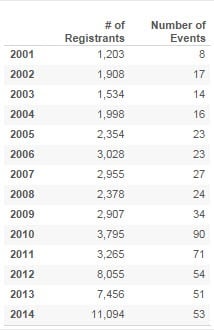
Take a look at the examples below which show the same data in a table format and in a colored bar chart. Looking at the table, does anything stand out to you? I’ll give you a minute … Maybe largest number of registrants in 2014? Anything else? What additional questions do you have?
Now, let’s take a look at the bar chart. Even without looking at labels or legends, our eye is drawn to the highest bar and the darkest color. What are those about? An analyst will be immediately curious about why the highest number of registrants and the most events are not happening in the same year. (It was as a result of a concerted effort to target market based on analytics data.) It is amazing how quickly we were able to go from looking at the data in a visual way to asking questions on the path to making informed decisions.