Steve Jobs said that computers are like a “bicycle for the mind” allowing us to go further faster with less effort. Within the field of business intelligence, I believe data discovery should be the same, amplifying our intelligence and creativity, allowing us to see patterns and insights which we can use to create the future of our organizations.
Data Visualization is Key
A key feature of data discovery is the ability to present data visually in order to quickly convey the information to our brains. The goal is to stimulate our minds and then to allow us to interact and have a direct “conversation” with the data. We “ask” follow-on questions by clicking through and moving elements on the screen, “re-presenting” the data many ways.
We are inspired when we see data visually and notice how it changes based upon the questions we ask. We can see the power as we interact with the data and the analysis process becomes a natural extension of the activity of thought, enabling us to drill down, drill up, filter, bring in more data sources, or create multiple visual interpretations. Interactivity supports visual thinking. We can work with the data visually at the speed of thought, rather than writing queries to the databases. We can learn and reach insights faster. When we interact with the data visually, we are participating in the data discovery process and data becomes our partner in gleaning the information that becomes business intelligence.
How Does your Association Make Decisions Today?
An MIT study shows that most organizations still rely on instinct, intuition, politics and tradition. But according to Harvard Business Review, top performing organizations are 5x more likely to use data to make decisions. If we know that decisions based on data tend to be better decisions, why don’t we use it all the time? Research says that only 15-20% of organizations believe they have access to the data they need in order to make good decisions. Why is this?
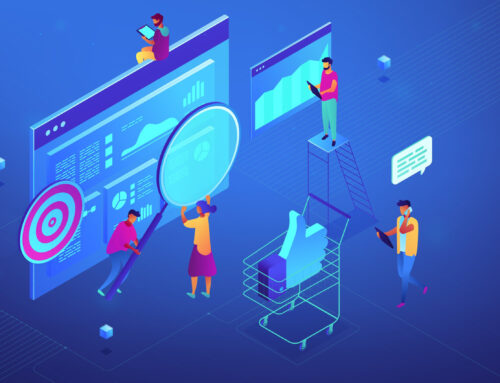
I once heard it explained this way – imagine you are Monet and you are explaining to a friend how to create a painting of Venice at twilight – like this one. You might say, start out with a church steeple on the left sort of a brownish color and surround it by a golden light, with deep blue in the sky. Oh yes, and maybe add some little purple/violet touches in the water to the right. Do you think your friend would create a painting that looks like this one? Probably not. And yet that is what is happening daily between business and IT. Business tries to describe in words the data that they want to see. And IT tries their best to represent in reports and dashboards what they heard the business say.
The way it typically works is you have a question and ask IT to create a query or report and then when they deliver it, usually you have another question, or want another piece of data or have it grouped a different way. Traditionally this change request has been considered a BAD thing! And then you have to wait for IT to revise it. At least that’s what used to happen to me when I worked for an association. This process doesn’t really work well for either the IT department or the business users in the association trying to make decisions.
Change the Ending
Association staff want access to their data! They don’t know their questions until they start to see the data. Data discovery enables them to have a conversation with the data directly. Data discovery allows all of us to shift perspective quickly and change the way we look at a problem. We can cycle through different views deliberately trying to get the insight to pop out!
This is how we learn to understand the story our data is telling. And once we understand the story, we can change the ending.