
One session from the Tableau Conference 2015 caught my eye: Using Color Effectively: Tips from a Color Science Researcher. Color is an important part of any visualization, and even more so for me because I am one of the 10% of males that is colorblind.
If you’re not familiar with colorblindness, here are some quick facts:
- It is more common in males than females.
- Black/white colorblindness is extremely rare. Most people that are colorblind can still see some color.
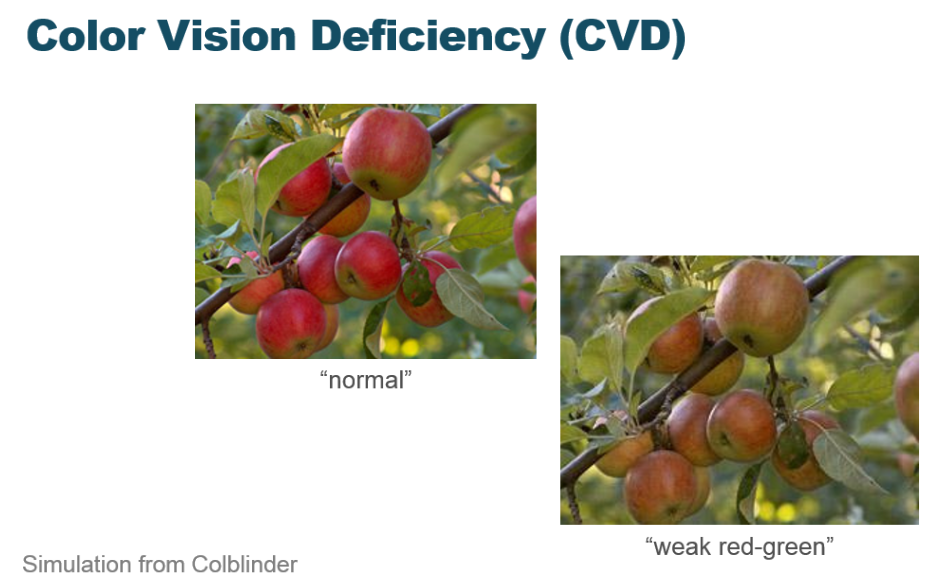
- The colors look different to us than someone without the deficiency. This can vary because there are different types. See the picture below for an example from the slide deck.
- Colorblindness is a genetic disorder passed through the mother, who most frequently is not colorblind herself.
If you are creating visualizations for your association, here are some helpful tips to keep in mind. These facts are from the presentation by Maureen Stone, a recognized member of the color and visualization research community who joined Tableau in 2012. She is dedicated to improving the use of color in Tableau.
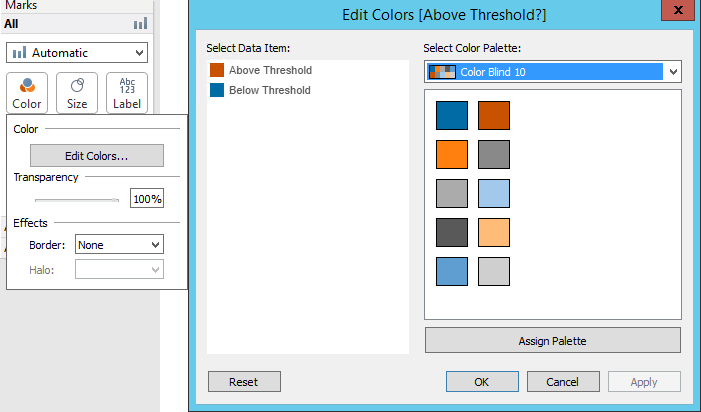
The first and most important tip is that built into Tableau there is a palette called Color blind 10. Use it! And use it all the time because lots of research has gone into it and it makes a difference. You can find it by clicking on Color under Marks, then the button for Edit Colors. You should see it in the list called Color Blind 10.
A useful example of the color blind palette is seen below:

On the left we see a gradient using a blue palette with increasing intensity. For someone like myself, it is nearly impossible to extract any useful information from this visualization. The scale is not helpful because the colors are so similar and the data sections so small that matching from the map to the scale is very difficult. By contrast, the map on the right uses a diverging color scheme and the patterns really pop. This is especially true for the streak of color that starts around Louisiana and breaks east and west from the northern end of it. Matching to the scale is still a little tricky with this color scheme, but I can quickly and easily recognize the extreme cases and broader patterns.
Another is semantic color, which is essentially assigning a color based on meaning. This example regarding vegetables should make the meaning clear.
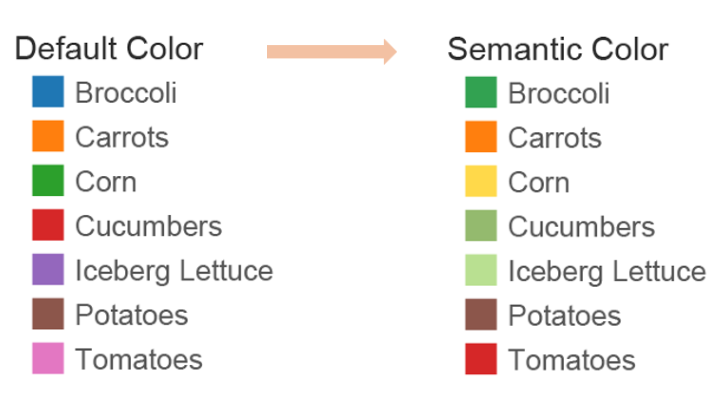
With semantic color choices, we can make associations using less conscious thought and reasoning which gets us to the meaning in the visualization faster. For associations, the consistent application of color for dimensions and measures (particularly within a single dashboard) can improve comprehension and reduce confusion.
Tableau and Maureen are continuing their work to make improvements, and I look forward to future color palettes and schemes. In the meantime, don’t overlook the importance that color plays in your visualizations. Finally, if you are looking for an extra set of color deficient eyes to run a visualization past, please don’t hesitate to reach out to me.
Note: All images are from the slide deck from this Tableau Conference 2015 presentation.


