Happy 4th of July! What a great time to think about data independence, democratization, and governance for your association. In this post we’ll talk about the balance between the central management of data by IT and data directly managed by association staff.
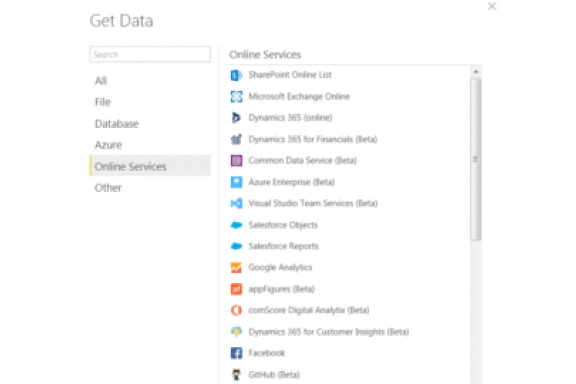
Leading analytics tools provide great capabilities to empower people to make data-guided decisions. The ability to analyze diverse data from a breadth of sources in a usable way for association staff is a key feature of these tools. Examples include Power BI Content Packs and Tableau Data Connectors. These range from pre-built data sources based on specific applications such as Dynamics, Google Analytics, and Salesforce; to relatively rarer “NoSQL” sources such as JSON, MarkLogic, and Hadoop data. These tools rapidly make data from specific applications available in formats for easy reporting, but can still lead to data silos. Tools such as Power BI and Tableau provide dashboard and drill-through capabilities to help bring these difference sources together.
Downstream Data Integration
This method of downstream integration is commonly described as “data blending” and “late binding”. An application of this approach is a data lake that brings all data into the environment but only integrates specific parts of data for analysis when needed. This approach does present some risks, as the external data sources are not pre-processed to enhance data quality and ensure conformance. In addition, business staff can misinterpret the data relationships that can lead to incorrect decisions. This makes formal training, adoption, and governance processes even more vital to analytics success.
What about the Data Warehouse?
When should you consider using content packs and connectors and how does this relate to a data warehouse and your association? The key is understanding that they do not replace a data warehouse, but is actually an extension of it. Let’s look at a few scenarios and approaches.
-
Key factors to consider when combine data is how closely the data is linked to common data points from other sources, the complexity of the data, and the uniqueness of the audience. For example, people throughout the association want profitability measures based on detailed cost data from Dynamics, while the finance group has reporting needs unique to their group. An optimal approach is to bring cost data into the data warehouse while linking content pack data by GL codes and dates. This enables finance staff to visualize data from multiple sources while drilling into certain detail as part of their analysis.
-
Another consideration is the timeliness of data needed to guide decisions. While the data warehouse may be refreshed daily or every few hours, staff may need the immediate and real-time ability review data such as meeting registrations, this morning’s email campaign, or why web content has just gone viral. This is like the traditional “HOLAP”, or
Hybrid Online Analytical Processing, approach where data is pre-aggregated while providing direct links to detailed source data. It is important to note that analytical reporting should not directly access source systems on a regular basis, but can be used for scenarios such as reviewing exceptions and individual transaction data. -
In some cases, you might not be sure how business staff will use data and it is worthwhile for them to explore data prior to integration into the data warehouse. For example, marketing staff might want to compare basic web analytics measures from Google Analytics against other data sources over time. In the meantime, plans can be made to expand web analytics to capture individual engagement, align the information architecture with a taxonomy, and track external clicks through a sales funnel. As these features are completed, you can use a phased approach to better align web analytics and promote Google Analytics data into the data warehouse. This also helps with adoption as it rapidly provides business staff with priority data while introducing data discovery and visualizations based on actual association data.
- Another important factor is preparing for advanced analytics. Most of what we’ve described involves interactive data discovery using visualizations. In the case of advanced analytics, the data must be in a tightly integrated environment such as a data warehouse to build predictive models and generate results to drive action.
It’s not about the Tools
The common element is that using data from sources internal and external to your association requires accurate relationships between these sources, a common understanding of data, and confidence in data to drive data-guided decisions. This makes developing an analytics strategy with processes and governance even more important. As we’ve said on many occasions: it’s not about the tools, it’s the people.
Your association’s approach to data democratization doesn’t need to rise to the level of a constitutional convention or lead to overly passionate disputes.


