A short time ago Tableau Software released a whitepaper entitled “5 Tips to Get More from Google Analytics,” and although it was full of valuable information, three tips stood out. The three in this post require that your Google Analytics data be extracted and analyzed with Tableau. This is easily done via direct connect using Google Analytics as a Tableau Software data source, or by using the Google Analytics API to extract the data daily and load it in your association’s data mart, which is the approach we use most often.
Tip 1: Advanced Analytics
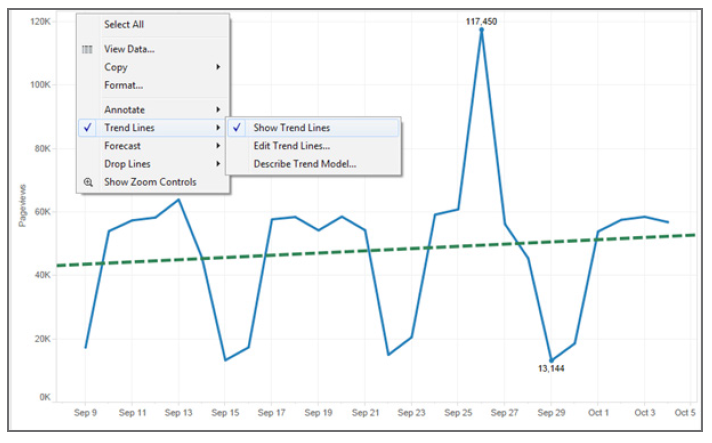
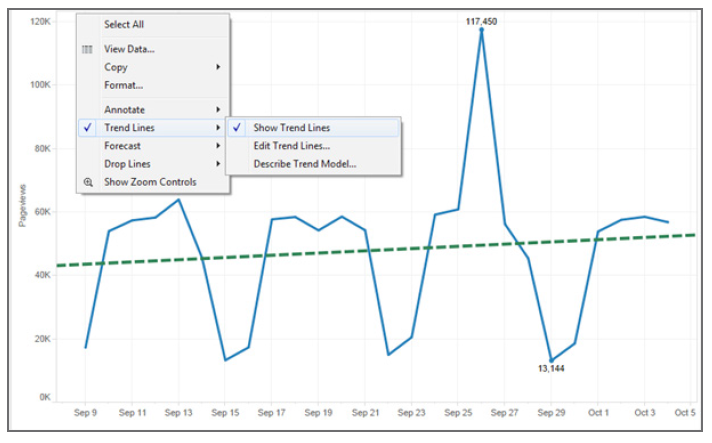
In analyzing web traffic, it is common to see peaks and valleys. For instance, a spike after an e-marketing message is sent, or valleys on the weekends and after business hours, or a spike before your association’s annual event. With Tableau it is easy to right click on the chart and add a trend line. Trend lines are valuable because they quickly show if web traffic is increasing or decreasing over time despite the common peaks and valleys.
Tip 2: Previous & Next Page Analytics
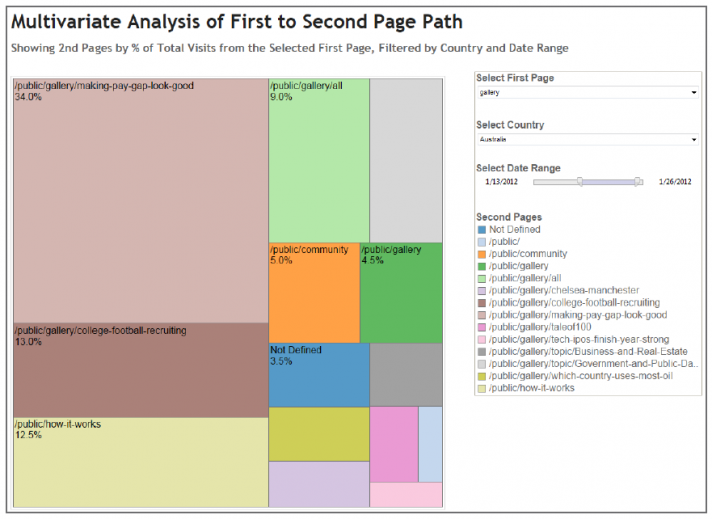
The Google Analytics documentation provides an excellent description of flow visualization reports, which in essence are visualizations that allow you to see how users are navigating through your association’s web site content. For example, you could see the path users are taking from landing on your annual conference microsite all the way through registration payment. As great as flow reports are, you will gain a deeper understanding in how to optimize your content once you see how the result change when analyzed by geographic region, member type or screen size (platform). Knowing this you could create a targeted marketing campaign to all the members (or customers) in Oklahoma which directs them to the page where the most common drop off occurs.
Tip 3: Data Blending
This topic keeps coming up, so obviously it is important. Data blending is exactly what it sounds like – taking separate data sources and combining them together to reveal new insights and draw new conclusions. The separate data sources should have a value in common, such as customer id. By blending your Google Analytics with your CRM data, you can give the web traffic an identity, based on a member type or role for example. When your association knows the type of information that different identities are seeking, you can then deliver the content that identity wants – that’s the best way to add value to the customer’s experience on your website.
Learning how visitors are accessing your content is an ongoing initiative and improving it is equally important. This information can inform business strategy and financial goals. It seems that many websites get a redesign every three years or so, and having this data on hand will make your next one amazing!
References:
Images provided by Tableau Software white paper, 5 Tips to Get More from Google Analytics,


