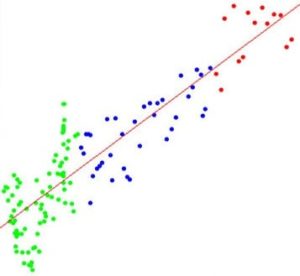
For example, say your members are organizations and you have separated them them into groups with common traits for marketing purposes – these are called “segments”. You have a hypothesis that there are certain factors such as revenue, industry, and other affiliations contribute into which segment an organization is placed. These factors are called “variables” in the analytics world. (Note: the assumption is your association has access to accurate data to analyze, such as your AMS, or perhaps a data warehouse or data mart.)
First you identify what exactly you are trying to accomplish and describe it in terms of data analysis. You want to know which of the available variables (independent) when combined, will most determine the segment (dependent). Regression is the best tool because it allows you to enter all variables into the model at once.
All the data must be converted to numbers before using statistical software, such as R or SPSS. Because most data is qualitative, this requires that a binary “dummy” variable be created. In other words, most data is stored in words, but for analytics we must convert the words to numbers. Once the words are converted to numbers (1 or 0), using multinomial logistic regression (with step-wise option) turns out to be the best technique to determine those variables (or factors) that are statistically significant in determining segment.
Often many of the factors revealed by the modeling will confirm your hypothesis, but there will probably be one or two that will be quite a surprise. For example, say the top 3 most influential factors turned out to be:
- Organization revenue
- Industry is retail
- Organization is in California
In your original hypothesis you may not have considered that organizations in California were so critical to segmentation. Now you have empirical evidence which will enable you to be more successful in the way you run marketing programs, manage content, and plan events.


