Attend a webinar or perform a web search on the topic of email marketing effectiveness and you’re essentially guaranteed to receive standard information about KPIs such as click rate and open rate. You might get so far as to discover that by combining proper email hyperlink formatting you can track that user’s clicks through your web site when you combine Google Analytics web tracking for a more complete picture of user interests. However, can you answer other basic questions about the emails you are sending besides their open and click rates, such as:
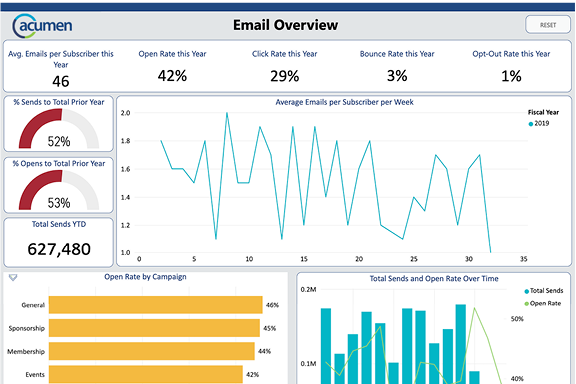
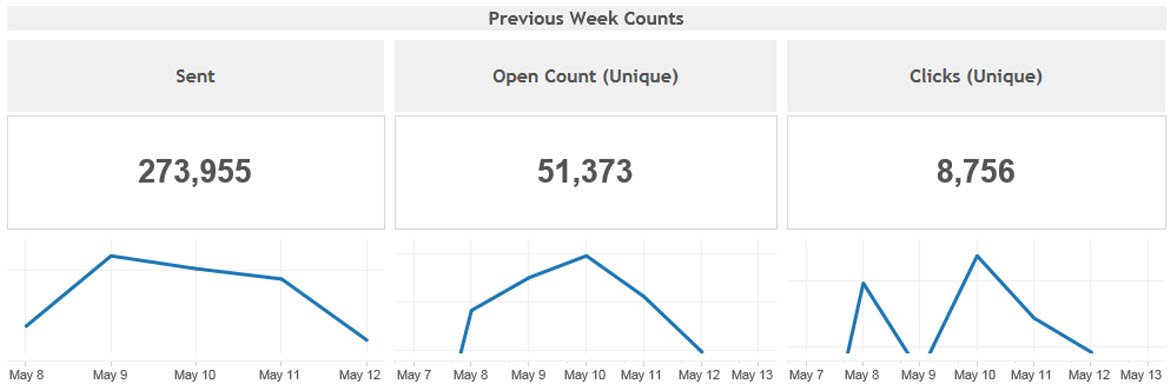
- How many messages have been sent in the past X period?
- Which campaigns (segmented groups) get the most messages sent, clicked, and opened?
- Which specific links were clicked the most?
- For the highest rated email links, did those click through users visit any other pages on the site?
- How long is it from when a message is sent to when it is opened? What about by a specific member type or job title?
- Which people and/or organizations had bounced messages and the reason?
- Who are the top and bottom individual email engagers based on opens or clicks?
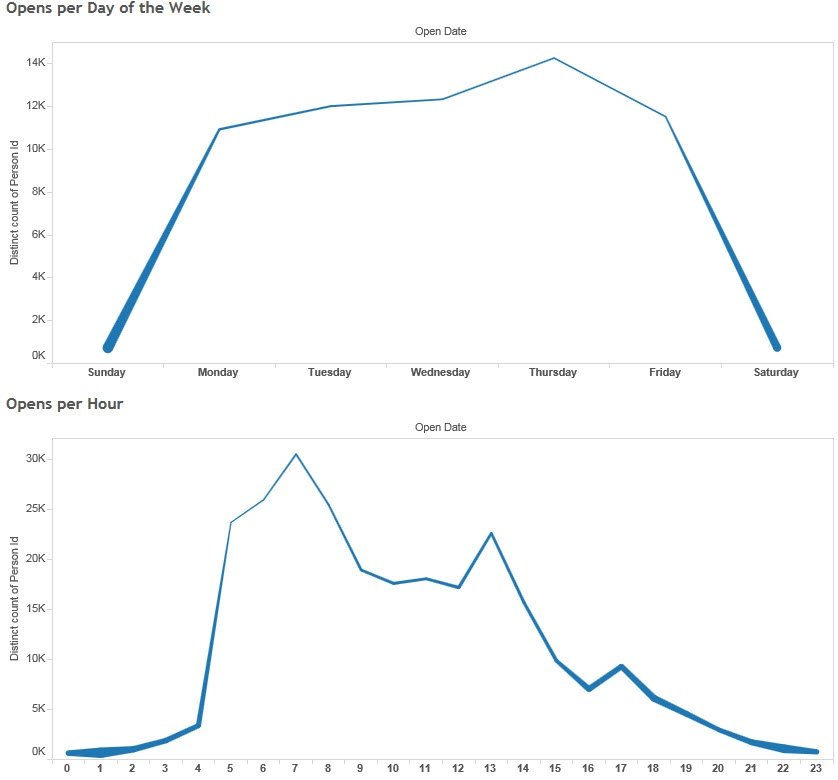
- What is the most popular day of the week for messages to be opened (sample shown below)?
- What is the most popular time of day to open a message (sample shown below)?
By including your email marketing statistics and your web traffic from Google Analytics in your data mart, you can answer these questions and more. Consider experimenting with A/B testing in your email marketing campaigns to see if the same message gets more opens when sent at a different time on the same day. Turn “spam” into perfectly timed and important content for your constituents.


