
There is a lot of value in combining data from one business area with data from another business area. Similar to a jigsaw puzzle, when we combine data sets and put the pieces together, we get a complete picture of customers, events, and activities. But how do you know what data to combine?
Take Inventory of What You Have
To get started, take inventory of the data you already have available in your business area. Let’s take members for example. Membership teams often require a high level of granularity. They also have years of membership data that can be leveraged. The data they have may be stored in their Association Management System, Customer Relationship Management system, and their Financial Management System.
After identifying the data sources, consider what data is stored in each data source. Identify the file type and how you extract or integrate the data with other systems.
Consider What’s Missing
To determine what data could augment your existing data source, think about the aspects of the customer or activity that you care about.
What information could help answer your business question? If you don’t have a business question, what information would provide additional insight on customer behavior?
The membership team typically has data on when a member joined, membership type, length of membership, contact information, and dues payments. What other information would help them understand members? It may be helpful to combine membership data with components from other areas such as the number of events attended in the past two years, the last meeting attended, age, member status, tenure in the industry, and total spending in the past year.
Combine and Analyze
Combine the data and analyze it. Look for trends ad relationships. Distill down the information so that each component of activity that is of interest is presented as attributes of that person.
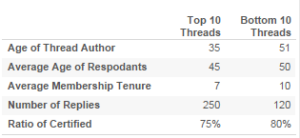
The table below shows some combined information as it relates to the Top 10 and Bottom 10 thread topics from an association’s online community. Using the information, we can see what a correlation may exist between a person’s attributes and the most active threads. From the data below, it looks like younger individuals with less membership tenure and professional development are replying and posting to threads generated by younger authors than the bottom threads. Perhaps action can be taken to target the younger members with messaging encouraging them and providing the benefits of authoring and responding to community posts.
Once you combine data, you can determine if there is actually a relationship between two data sets. You can also see if you need additional data to augment your analysis. Using business intelligence tools, like Tableau, allows you to easily connect data sets and experiment.


