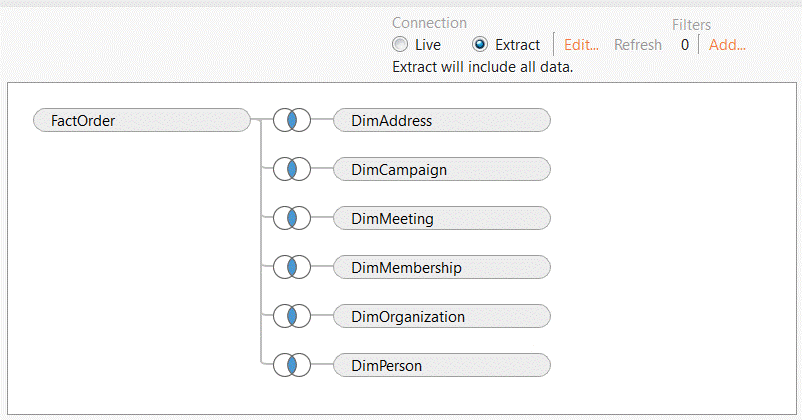
Just as associations have a treasure of diverse data waiting to have a conversation, Tableau offers a variety of options for interacting with your organization’s data to enable association analytics.
- Live data source connection – serves as a pass-through to a data mart or source systems that submits queries during interaction
- Published data source – contains connection information that is independent of any workbook and can be used by multiple workbooks
- Packaged workbook – encompasses data source connection information associated with a specific workbook
Data extracts leverage Tableau’s high-performance data engine that is based on VizQL, a technology that combines data querying and visualization,and does not require the limitation of
completely loading data into memory. This means that business staff can efficiently explore data with fast responsiveness.
Published data sources can be used by multiple workbooks to benefit from consistent customized folders, field-level customizations, data hierarchies, calculated fields, dimension/measure assignments, and data selection criteria. This ensures that any changes, such as the assignment of business-friendly names, will automatically be available to all visualizations and dashboards using the data source. The underlying data is automatically refreshed based on customizable schedules. Published data sources can also be organized by project and contain keyword tags to facilitate discovery. These and other benefits make published data sources the optimal option for association analytics.
Data to Match the Business
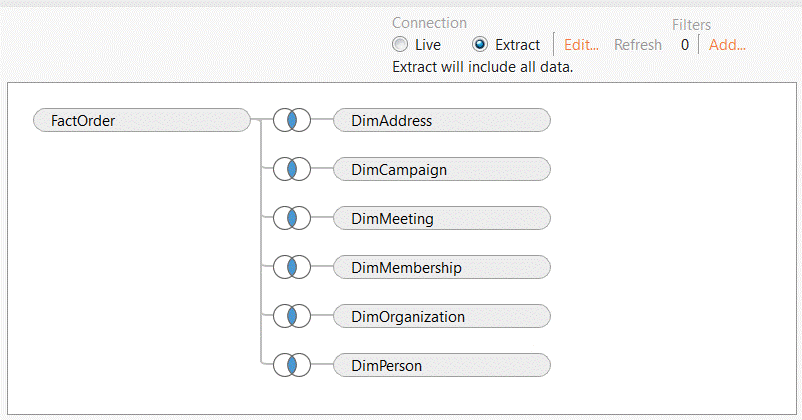
The process of creating and editing data sources involves interacting with databases or other data formats. Source data should be optimized for analysis and structured in a way that matches business processes. A process to align data organization with actual business events and analysis goals such as Modelstorming ensures valuable business staff engagement and future flexibility. Adding a new attribute involves simply adding it to a descriptive dimension table, while new dimensions can be quickly created and aligned with fact tables representing measured business events. Likewise, new business events can be rapidly linked to existing descriptive dimension tables.
More Data to More People
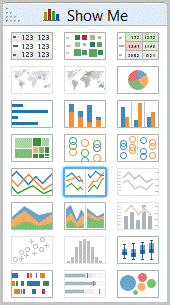
Business staff throughout the organization can create and edit visualizations leveraging published data sources using a browser-based Web Edit feature that is part of Tableau Server and Tableau Online. This feature provides an optimal set of capabilities similar to Tableau Desktop and does not require additional licenses. These features include the ability to create any visualization type from the same data sources as Tableau Desktop. In addition, custom edit and view permissions can specify which groups can access data sources and create visualizations.
The Analytic Workflow
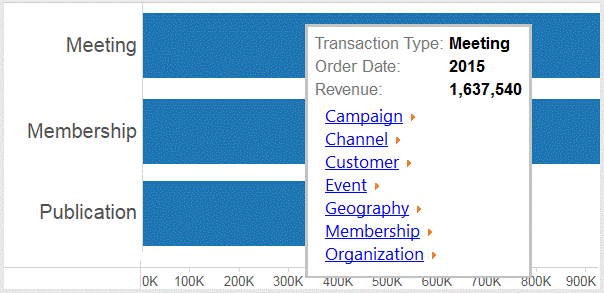
In addition to rapidly creating data sources for exploration, visualizations and dashboards should align with a process for analytic thinking. A common scenario involves business staff reviewing and interacting with higher-level dashboards to guide focus and spawn additional questions. Traditionally, the analyst would then need to review individual reports to address an initial set of questions. Dashboard and worksheet actions enable context-specific navigation and filtering which matches the data discovery process. For example, a chart might trigger curiosity about a specific product category, such as “How are events including in this total distributed? Did marketing campaigns contribute substantially to this total? What are geographic patterns?”
A menu of potential dimensions can be available that guides exploration towards visualizations automatically filtered by the context of the bar chart value. The result is ongoing questions and answers about the data. The opportunities are limitless and help foster individual curiously and an analytic culture in your association. The right implementation of these data exploration capabilities with the a data layer created specifically for the association will liberate the data and enable data-guided decisions for your association.


