Each Labor Day weekend, analysts discuss the impact of gasoline prices and other factors on travel driven by an extra day off and the symbolic end of summer. Some estimates indicate that a greater number of travelers by car saved a collective $1.4 billion this year, much of which was spent elsewhere during trips.
Deciding if and when to travel greater distances is a more complicated process since it often requires relatively expensive air travel with a commitment in advance. The price of airline tickets is significantly determined by the timing of purchase relative to travel. Analytics indicate that the optimal time to purchase tickets is generally between three and eight weeks prior to travel. The specific timing changes based on the time of year and also varies significantly by departure and arrival airports. It unfortunately does not require advanced analytics to observe that prices tend to rapidly increase beginning two weeks prior to travel.
Associations effectively create similar opportunities for customers through meetings and events. Associations spend considerable time and effort on planning and marketing activities based on a range of customer data including prior event participation, topical interests, individual engagement, meeting sessions, organization characteristics, continuing education requirements, and demographics. Registration patterns are closely monitored against prior year’s activity and current goals. Sometimes these patterns are not consistent with historical data. In some cases a trend of early registrants fails to continue and in other cases a late surge of registrants follows a period of marketing efforts.
Associations can supplement their AMS data with external sources to help explain such patterns. The U.S. Census Bureau makes very useful geographic data available including zip codes with latitude/longitude mapped to several other data points. The Census Bureau also offers an application programming interface to obtain detailed geographic data for specific addresses. This data can be used to calculate the distance between two points (it’s kind of a long story that involves the trigonometry I never thought I would use such as sine, cosine, and inverse tangent). Tableau data visualization software provides out-of-the-box geographic visualization capabilities based on data including zip code, area code, city, metropolitan/micropolitan statistical area, and even congressional district.
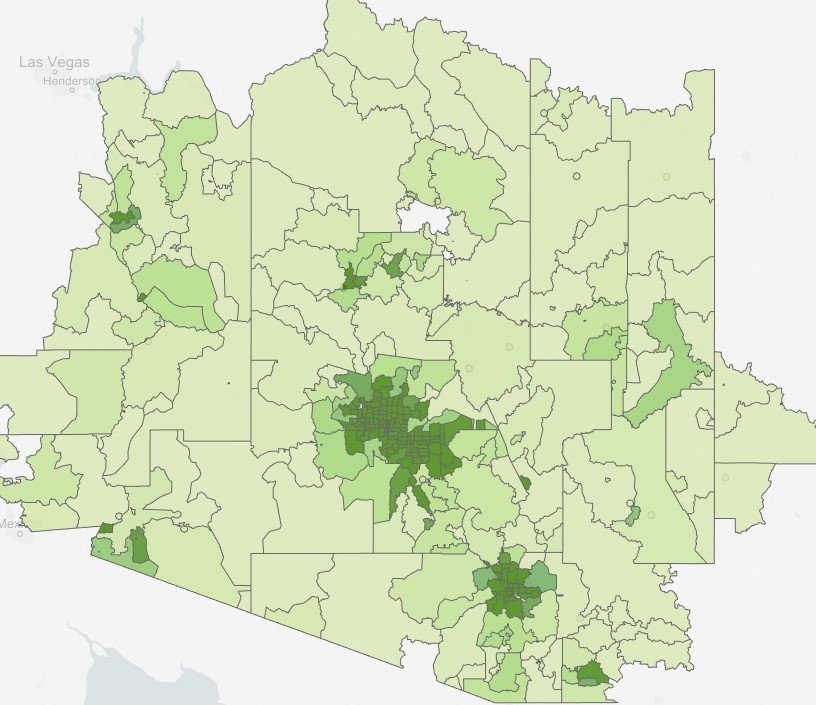
Various surveys and other analytics estimate that a common comfortable distance for car travel is around 200 miles. Here is a map created using Tableau showing the population density by zip code within a 200 mile radius of Phoenix:
Here is a similar map based on the same color scale for Chicago:
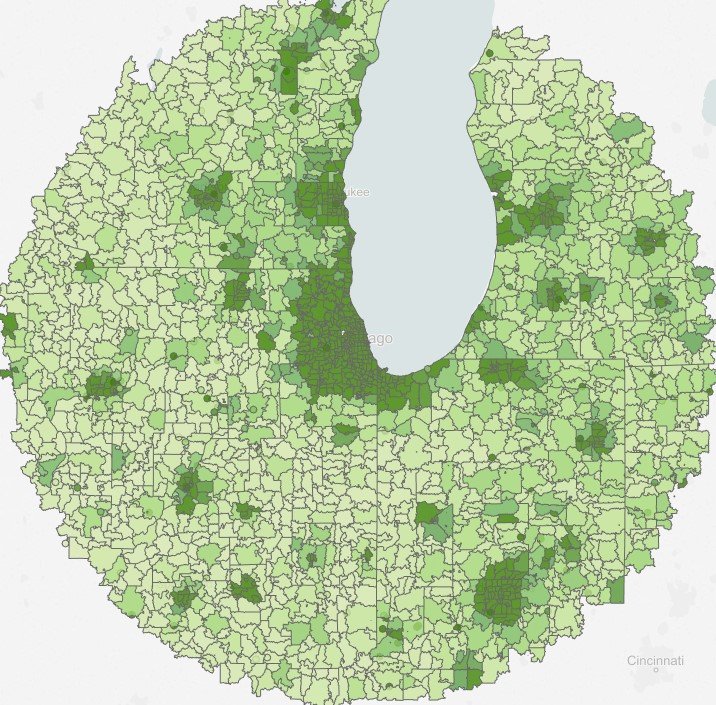
A far greater number of individuals are likely to consider driving to a meeting in Chicago than a meeting in Phoenix. It is important to note that this straight line distance is clearly a rough estimate and encountering a large body of water such as Lake Michigan would challenge even the most dedicated meeting attendee. Fortunately you can leverage more advanced data sources such as the Google Maps API to estimate driving distances.
This data provides associations with great analytics opportunities to drive meeting participation by aligning with customer travel decisions. For example, marketing campaigns can consider travel decision timing and target specific airport markets. Registration pricing deadlines for individual events can incorporate location analytics. Your association can also create opportunities for strong customer engagement through efforts to help groups of potential meeting attendees organize buses together or even carpool.
Deriving travel distance analytics from customer location data is an example of gaining value from data. This demonstrates why it is important to consider analytics when designing business processes throughout the organization and not just as part of analysis after the fact. Increased meeting attendance often contributes to other benefits including member retention, publication revenue, engagement, and membership recruitment.
Understanding the impact of customer travel scenarios is a great way to leverage association analytics to create the future and grow your number of happy conference attendees.


