You may not realize it, but you are sitting on a treasure trove of data in your AMS. And while it’s great for specific uses in day-to-day operations like transactional, process renewals or course payments, it can’t help you answer complex questions (see our previous blog, Your AMS Wasn’t Designed for That). Your AMS focuses more on current and past data, however with analytics, you can use this data, and data from your other source systems, to be more forward-thinking.
One of the main reasons it’s challenging to answer more complex questions using your data is because it’s strewn between multiple platforms like your website, email, event management, community and online learning systems. It’s not uncommon for up to 80% of data to live outside of an AMS, making it difficult to see the full picture of your members.
Here are some questions associations have that can’t be answered by your AMS alone:
- Which members are more likely to renew? Or are less likely to renew?
- Who is likely to attend an upcoming event?
- Which courses might lead to additional sales and which ones are dead ends?
- Which programs matter most to our members?
- Who are the community influencers on trending topics?
- What are real-time trends and demographics of our meeting registrants?
- What products should we sunset?
- Are active online community users more apt to purchase a product?
Using data from your AMS, analytics will help you answer these more complex questions.
Why analytics?
People often confuse reporting and analytics. Both are valuable yet have distinct differences.
- Reporting is rear-facing, looking back on what happened: It’s about organizing information using past data. Reports help you understand what has happened.
- Analytics tell you the “why.” Analytics allow you to unearth why something is happening. Data analytics are future-focused, giving you information in near-real time, to help you take action. An analytics platform, like Acumen, will help you find things to make business decisions.
Here are our top four ways to expand the value of your AMS.
4. Data Integration
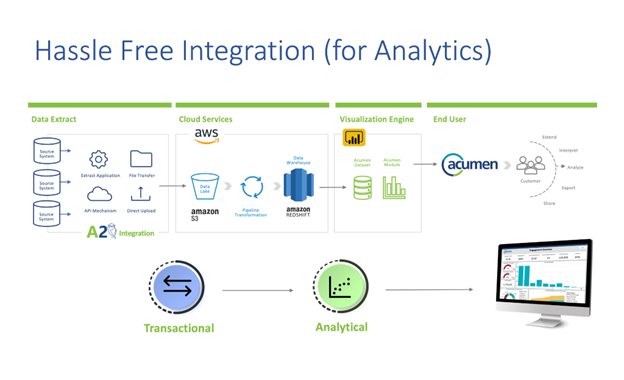
Your association is likely using more than one system that captures data. A lot of this data isn’t transferred to your AMS which means reporting from it will provide an incomplete picture. By integrating the data from your key systems into an analytics platform, you can maximize the use of your data. We suggest you use a “best of breed” platform that already exists. Using platforms that are already being used successfully by other organizations will save you time and money on building them yourself. You can certainly build your own, but we only recommend that when there is something unique to your association that you can’t take advantage of in existing technology.
Here’s an example of an analytics integration with an existing AMS.
3. Visual Reporting
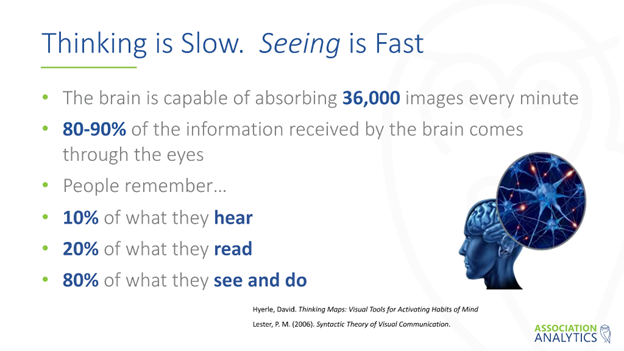
At Association Analytics, visual reporting is one of our favorite things about data analytics. Visual reports are intuitive. Seeing and interacting with data helps you retain information. Research shows that people remember 80% of what they see and do. This is much higher than remembering what they see or hear.
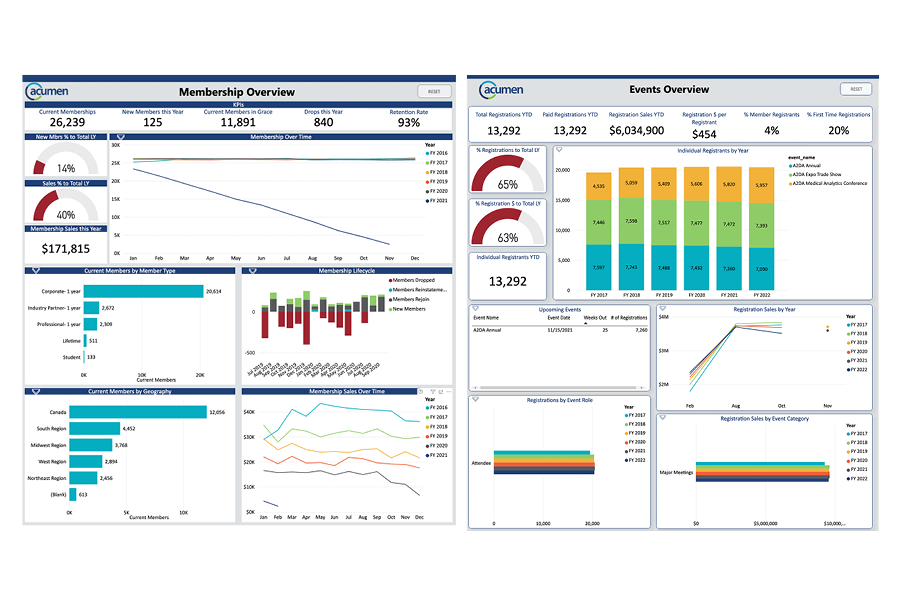
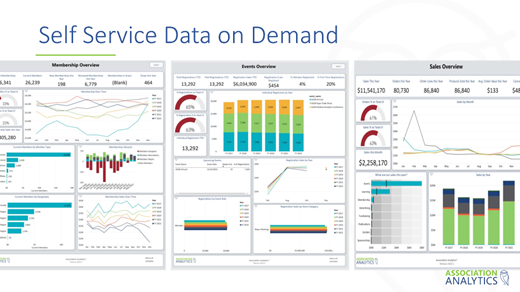
With a self-service on-demand dashboard, you can start exploring questions and finding the answers. On-demand dashboards also means no more waiting for your IT team to run reports every time you have a new question. This saves time and improves collaboration across the organization. And everyone will have the same dashboard and can use it as needed. Finally, data truly at your fingertips.
Here’s an example using our analytics platform, Acumen:
2. Data Exploration
Look beyond just knowing a member registered for an event. Go deep with data and determine things like how many events they attended before, how many courses they took while also considering their demographic data. This gives you a more robust picture of this member to help you find similar members who might also register for the event.
Look at trends over time. An AMS is good about reporting on current data, but analytics can go back in time. Analytics also helps you observe preferences and interests.The use of advanced filtering gives you the ability to find similar members and can build a robust profile of a particular member or types of members – similar to how Netflix suggests other shows based on your watching habits. Additionally, looking at the overlap of actions people take and their next actions can help you build personas and lists.
1. Advanced Analytics / Derived Data
Having advanced analytics gives you insights to further drive your business decisions. Here are some examples of how you can put derived data to use:
- Use advanced analytics to help you create member Engagement Scores. Find out more about Engagement Scoring in our previous webinar.
- Correlation of behaviors. Look at retention rates by member type and correlated behavior to identify what members are more likely to renew.
- Start to build Predictive Models. Drive what might happen next based on characteristics and previous behavior to calculate the likelihood of a particular action happening.
- Sentiment Analysis. 80% of your data is most likely unstructured Ilke posts in communities. Use this type of data to see what people are talking about and what topics are trending, then create new content to address your member needs.
- Create Recommendations. You can recommend specific content to target audiences. People like you purchased this course… People like you are reading this article…
When your AMS is integrated with an analytics platform, you can expand the depth and breadth of how you use your data. If you’d like to hear more on this topic, you can watch our on-demand webinar.
Our data-loving experts at Association Analytics can also help answer any questions you have about how to maximize the rich data in your AMS using analytics. Feel free to schedule a quick call with one of them at any time.


